USD/CAD retreats after soft CPI data from the USD, holds the 100-day SMA
Abstract:On Thursday, the USD/CAD pair took a step back towards the 1.3400 region, while maintaining its position above the significant support of the 100-day Simple Moving Average (SMA) at 1.3390.

• USD/CAD trades with losses near 1.3400 as bulls battle to defend the 100-day SMA at 1.3390.
• Core CPI from the US dropped to 4.7% in July, and Jobless Claims picked up in August.
• Lower yields and dovish bets weakened the USD. Eyes on Fed speakers.
On Thursday, the USD/CAD pair took a step back towards the 1.3400 region, while maintaining its position above the significant support of the 100-day Simple Moving Average (SMA) at 1.3390. The drop of the USD was prompted by weak inflation data; conversely, the CAD was hit by overbought conditions resulting from a correction in oil prices. Data released by the US Bureau of Labor Statistics indicated that the US Consumer Price Index (CPI) for July saw a month-on-month increase of 0.2%, in line with expectations. However, the annual measure dipped to 3.2% year-on-year, a touch below the anticipated 3.3%. Additionally, the core CPI advanced by 0.2% in the same month as expected, while the year-over-year metric fell to 4.7%, slightly beneath the forecasted 4.8%. Further compounding the situation, initial jobless claims for the first week of August rose to 248,000, exceeding the predicted 230,000 and surpassing the preceding week's 227,000. This development signals a potential relaxation in the labor market.
As a reaction, the US bond yields have weakened across the curve. The 10-year bond yield fell to 4.01%, while the 2-year yield sits at 4.77% and the 5-year yielding 4.12%. Downward movements reflect dovish bets on the Federal Reserve (Fed), and according to the CME FedWatch tool, markets are confident that the Fed wont hike either in September or in November. However, incoming data will be the ones which shape the next monetary policy decisions.
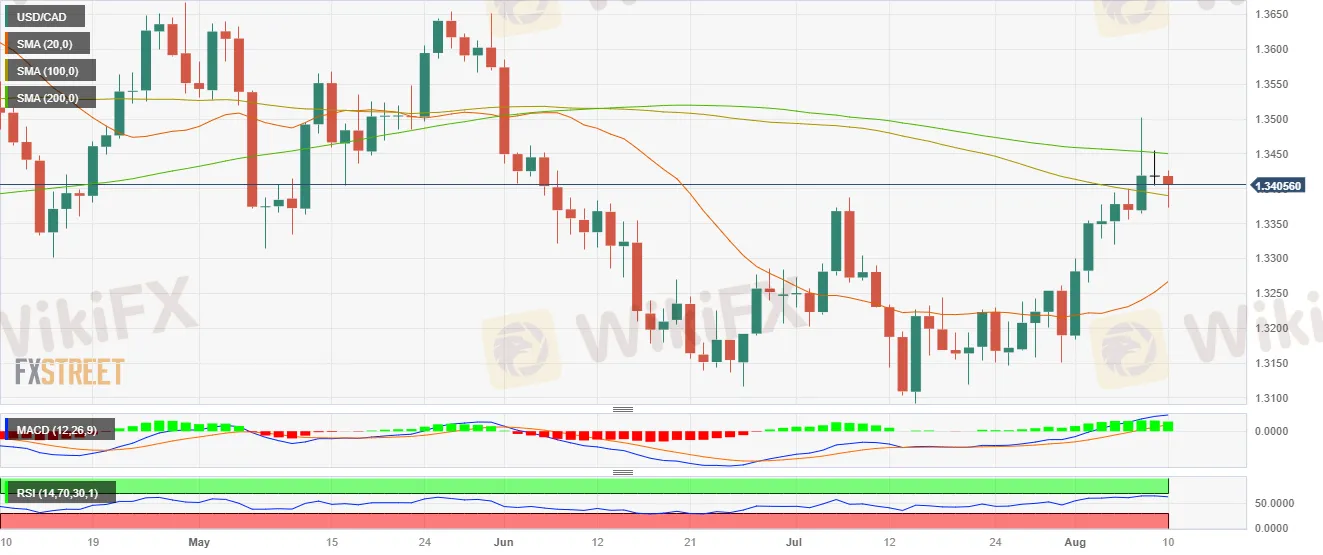
USD/CAD Levels to watch
The daily chart shows exhaustion for the USD/CADs bulls. The Relative Strength Index (RSI) displays a negative slope but stands above its midline, while the Moving Average Convergence (MACD) prints decreasing green bars. On the bigger picture, the pair is above the 20 and 100-day Simple Moving Averages (SMA) but below the 200-day SMA, highlighting the continued dominance of bulls in the broader perspective. However, buyers must soon overcome the 200-day SMA to confirm an upward trajectory.
Support levels: 1.3380 (100-day SMA),1.3350, 1.3300.
Resistance levels: 1.3450, 1.3500 (200-day SMA), 1.3550.
USD/CAD Daily chart


Read more

Broker Comparsion: FXTM vs AvaTrade
FXTM and AvaTrade are two well-established online brokers offering forex and CFD trading across global markets. Both enjoy strong reputations and high ratings on WikiFX—FXTM holds an AAA overall rating, while AvaTrade scores 9.49/10, indicating they’re regarded as reliable choices by the community. However, since brokers have great reputation in the industry, how do we know which one is more suitable for individuals to invest in? Today's article is about the comparison between FXTM and AvaTrade.

Shocking Move: Yen Breaks Past 140 Barrier!
The yen's breakout above the 140 mark has caught global attention, and the reasons behind it are more than technical.

FINRA fines SpeedRoute for alleged rule violations
The Financial Industry Regulatory Authority (FINRA) has imposed a $300,000 fine on SpeedRoute LLC for a series of supervisory, risk management, and anti-money laundering (AML) program deficiencies spanning from 2017 to the present. Of this amount, $75,000 is payable to FINRA, with the remainder offset by SpeedRoute’s limited ability to pay. In addition to the monetary penalty, SpeedRoute has been censured and ordered to overhaul its compliance framework, including enhancing its written supervisory procedures (WSPs) for market access controls and strengthening its AML program.

Nigeria's Oil Crisis: How Are Stakeholders Responding?
Despite being rich in oil, Nigeria struggles with refining shortages. What’s behind this paradox, and how are different actors reacting?
WikiFX Broker
Latest News
Love, Investment & Lies: Online Date Turned into a RM103,000 Scam
 WikiFX
Broker’s Promise Turns to Loss – Funds Disappear, No Compensation!
WikiFXBroker Took 10% of User's Profits – New Way to Swindle You? Beware!
WikiFXPi Network: Scam Allegations Spark Heated Debate
WikiFXBroker Comparsion: FXTM vs AvaTrade
WikiFXAccount Deleted, Funds Gone: A New Broker Tactic to Beware Of?
WikiFXEl Salvador and U.S. Launch Cross-Border Crypto Regulatory Sandbox
WikiFXThe Instagram Promise That Stole RM33,000
WikiFXKraken Partners with Alpaca to Offer U.S. Stocks and Crypto
WikiFXBefore You Trade the Next Big Thing, Remember the Dot-Com Collapse
WikiFXRate Calc
