WIKIFX REPORT: Will Amadeus IT Stock Make Another Push Higher?
Abstract:Looking at the technical picture of the Amadeus IT Group SA (BME: AMS) stock on our 4-hour chart we can see that as of yesterday, the share price managed to overcome a short-term tentative downside resistance line taken from the high of May 30th. For now, AMS continues to trade above that line, meaning that more byers might see it as a good sign to step in. We will take a positive approach for now.
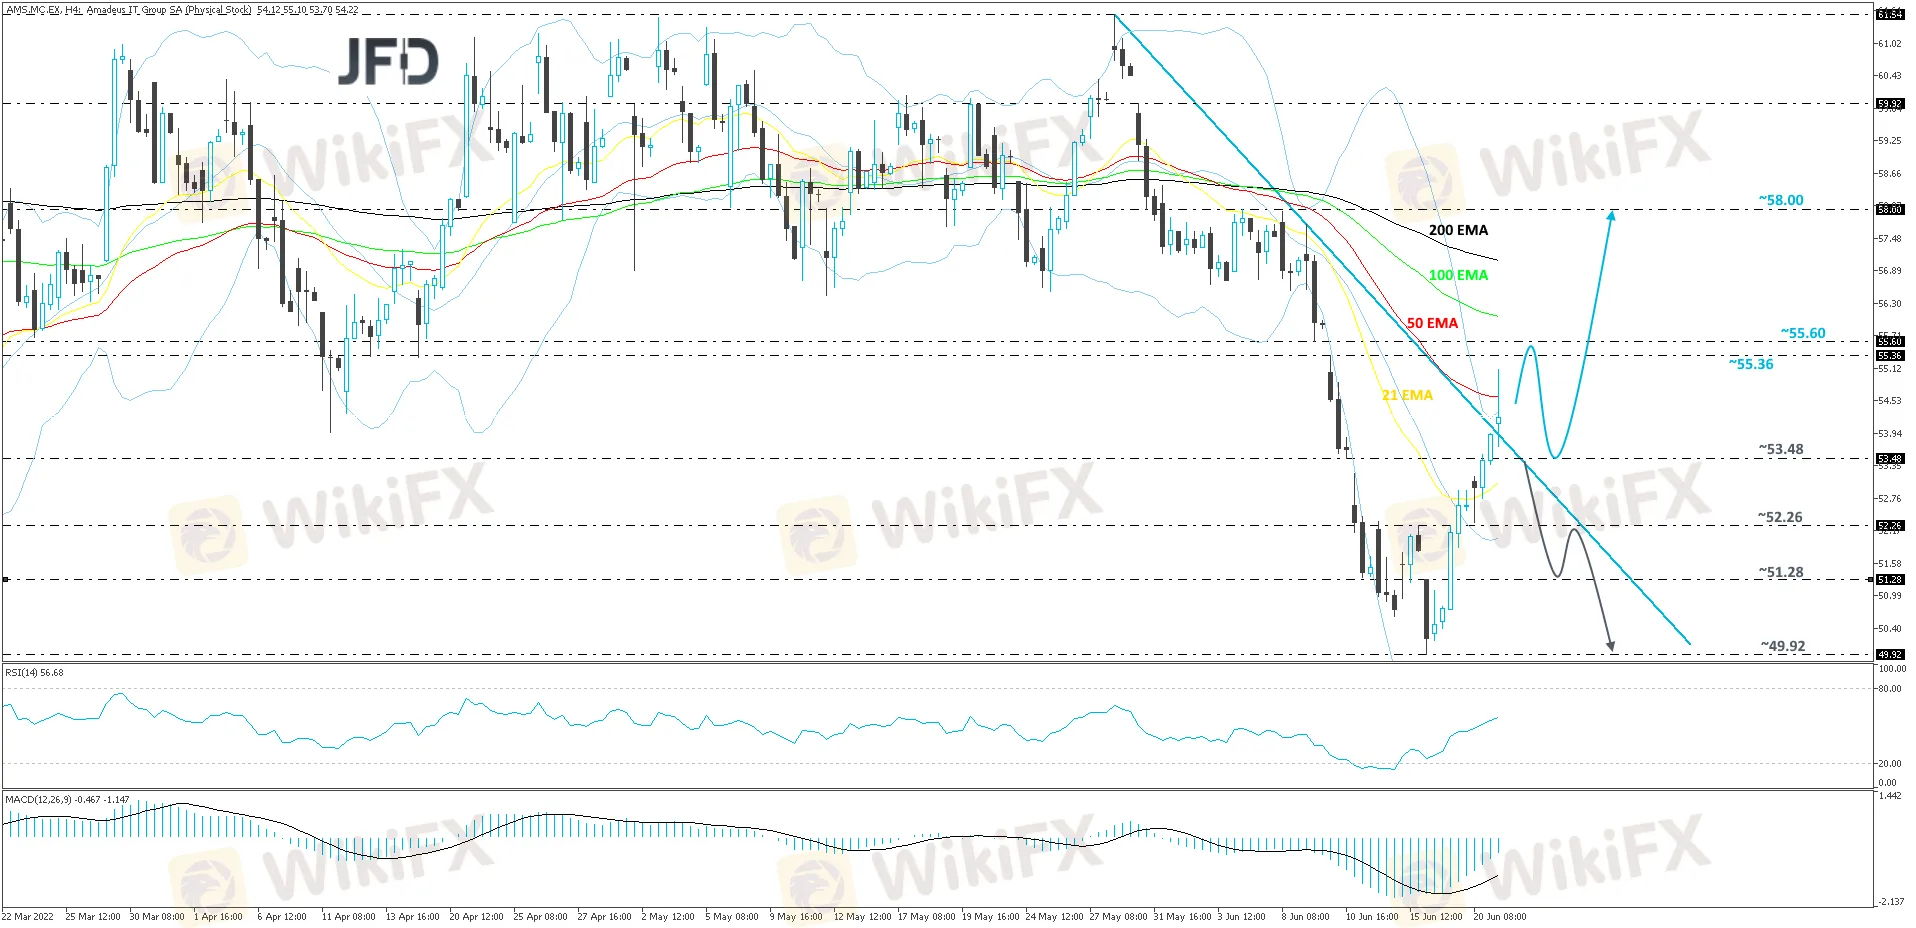
Looking at the technical picture of the Amadeus IT Group SA (BME: AMS) stock on our 4-hour chart we can see that as of yesterday, the share price managed to overcome a short-term tentative downside resistance line taken from the high of May 30th. For now, AMS continues to trade above that line, meaning that more byers might see it as a good sign to step in. We will take a positive approach for now.
A further push north may bring the price to its next potential resistance area between the 55.36 and 55.60 levels, marked by the high of June 10th and the low of June 9th respectively. Initially, AMS could stall there for a bit, or even correct slightly lower. However, if the stock is able to stay somewhere above the aforementioned downside line, another move higher might be possible. If this time the price can overcome the previously mentioned resistance area, this may open the door for a move towards higher hurdles, where the next one could be at 58.00, marked by the high of June 6th.
The RSI and the MACD are pointing higher. Additionally, the RSI is above 50, showing positive price momentum. However, the MACD is above the signal line, but remains below zero, while slowly grinding towards it. Both indicators are pointing upwards, however, to get more positive with higher areas, a break above 55.60 would be needed.
Alternatively, a price-drop back below the previously mentioned downside line and below the 53.48 zone, marked by the low of June 10th, could temporarily scare off some buyers from the arena. AMS may then fall to the 52.26 obstacle, or to the 51.28 hurdle, marked by the inside swing high of June 16th. If the buyers are still nowhere to be found, the stock might slide again and the next target could be at 49.92, marked by the low of June 16th.

Read more

Account Deleted, Funds Gone: A New Broker Tactic to Beware Of?
The main trading dashboard account of a trader for LQH Markets was completely deleted by a broker. The trader is not being offered any access to their funds or profits. This incident shows the risks of trading markets and brokers and the importance of protecting your funds without relying on any broker.

CySEC reaches €20k settlement with ZFN EUROPE
According to report, the Cyprus Securities and Exchange Commission (CySEC) announced today that it has entered into a settlement agreement with ZFN EUROPE Ltd for the amount of €20,000. This settlement resolves a regulatory inquiry into ZFN Europe’s compliance with Cyprus’s Investment Services and Activities and Regulated Markets Law of 2017, as amended.

PrimeXBT Expands Trading Options with Stock CFDs on MT5
PrimeXBT launches stock CFDs on MetaTrader 5, offering shares of major U.S. companies with crypto or USD margin for enhanced multi-asset trading.

Broker Comparsion: FXTM vs AvaTrade
FXTM and AvaTrade are two well-established online brokers offering forex and CFD trading across global markets. Both enjoy strong reputations and high ratings on WikiFX—FXTM holds an AAA overall rating, while AvaTrade scores 9.49/10, indicating they’re regarded as reliable choices by the community. However, since brokers have great reputation in the industry, how do we know which one is more suitable for individuals to invest in? Today's article is about the comparison between FXTM and AvaTrade.
WikiFX Broker
Latest News
Love, Investment & Lies: Online Date Turned into a RM103,000 Scam
 WikiFX
Broker’s Promise Turns to Loss – Funds Disappear, No Compensation!
WikiFXBroker Took 10% of User's Profits – New Way to Swindle You? Beware!
WikiFXPi Network: Scam Allegations Spark Heated Debate
WikiFXBroker Comparsion: FXTM vs AvaTrade
WikiFXAccount Deleted, Funds Gone: A New Broker Tactic to Beware Of?
WikiFXEl Salvador and U.S. Launch Cross-Border Crypto Regulatory Sandbox
WikiFXThe Instagram Promise That Stole RM33,000
WikiFXKraken Partners with Alpaca to Offer U.S. Stocks and Crypto
WikiFXBefore You Trade the Next Big Thing, Remember the Dot-Com Collapse
WikiFXRate Calc
