WIKIFX REPORT: Ichimoku Cloud Analysis 20.07.2022 (EURUSD, USDCAD, NZDUSD)
Abstract:The Ichimoku Cloud is a group of technical indicators that displays momentum and trend direction, as well as levels of support and resistance. It accomplishes this by averaging several averages and charting them. Additionally, it computes a "cloud" using this data in an effort to predict potential future areas of support and resistance for the price.
The Ichimoku Cloud is a collection of technical indicators that show support and resistance levels, as well as momentum and trend direction. It does this by taking multiple averages and plotting them on a chart. It also uses these figures to compute a “cloud” that attempts to forecast where the price may find support or resistance in the future.
Let's take a look at the recent Ichimoku Cloud Analysis
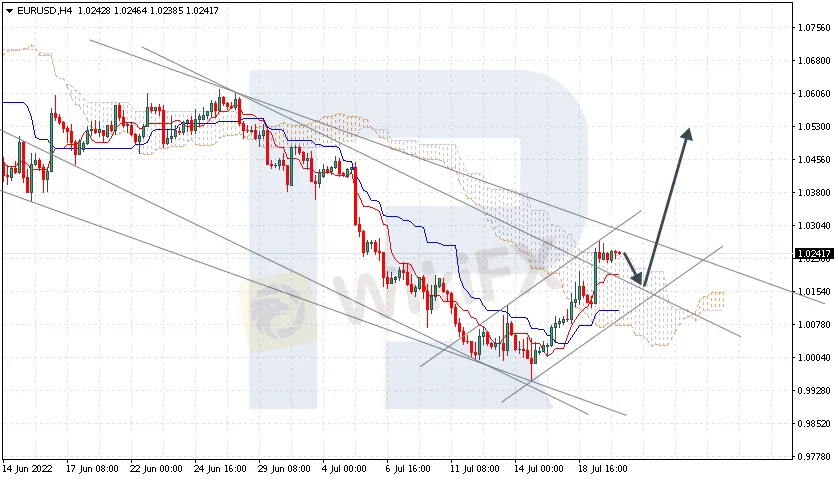
EURUSD, “Euro vs US Dollar”
EURUSD is about to break the bearish channel‘s upside border. The instrument is currently moving above Ichimoku Cloud, thus indicating an ascending tendency. The markets could indicate that the price may test the cloud’s upside border at 1.0155 and then resume moving upwards to reach 1.0530. Another signal in favour of a further uptrend will be a rebound from the descending channel‘s upside border. However, the bullish scenario may no longer be valid if the price breaks the cloud’s downside border and fixes below 1.0005. In this case, the pair may continue falling towards 0.9905. To confirm a further uptrend, the price must break the bearish channels upside border and fix above 1.0335.
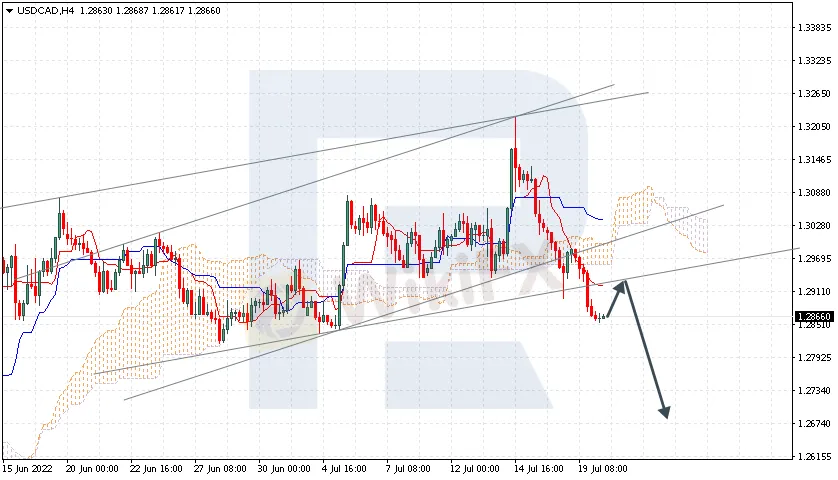
USDCAD, “US Dollar vs Canadian Dollar”
USDCAD is rebounding from the support area. The instrument is currently moving below Ichimoku Cloud, thus indicating a descending tendency. The markets could indicate that the price may test Tenkan-Sen at 1.2910 and then resume moving downwards to reach 1.2675. Another signal in favour of a further downtrend will be a rebound from the rising channel‘s downside border. However, the bearish scenario may no longer be valid if the price breaks the cloud’s upside border and fixes above 1.3105. In this case, the pair may continue growing towards 1.3205.
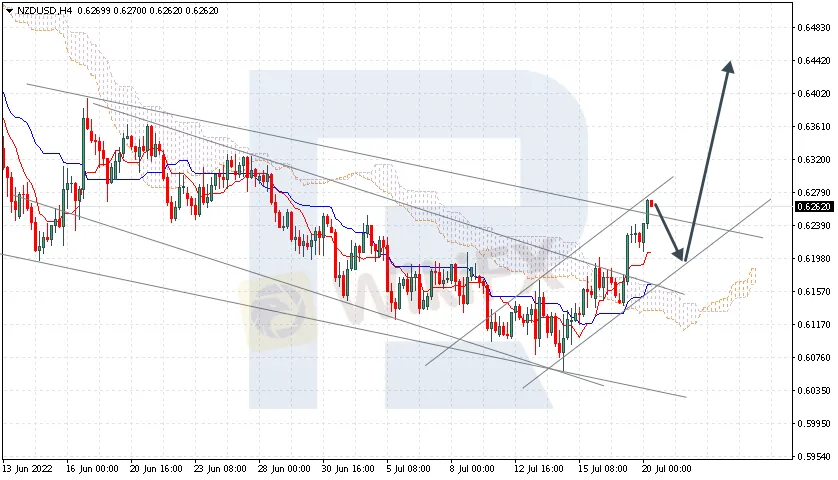
NZDUSD, “New Zealand Dollar vs US Dollar”
NZDUSD is growing within the bullish impulse. The instrument is currently moving above Ichimoku Cloud, thus indicating an ascending tendency. The markets could indicate that the price may test Tenkan-Sen at 0.6195 and then resume moving upwards to reach 0.6445. Another signal in favour of a further uptrend will be a rebound from the descending channel‘s upside border. However, the bullish scenario may no longer be valid if the price breaks the cloud’s downside border and fixes below 0.6095. In this case, the pair may continue falling towards 0.6005.

Read more

Account Deleted, Funds Gone: A New Broker Tactic to Beware Of?
The main trading dashboard account of a trader for LQH Markets was completely deleted by a broker. The trader is not being offered any access to their funds or profits. This incident shows the risks of trading markets and brokers and the importance of protecting your funds without relying on any broker.

CySEC reaches €20k settlement with ZFN EUROPE
According to report, the Cyprus Securities and Exchange Commission (CySEC) announced today that it has entered into a settlement agreement with ZFN EUROPE Ltd for the amount of €20,000. This settlement resolves a regulatory inquiry into ZFN Europe’s compliance with Cyprus’s Investment Services and Activities and Regulated Markets Law of 2017, as amended.

PrimeXBT Expands Trading Options with Stock CFDs on MT5
PrimeXBT launches stock CFDs on MetaTrader 5, offering shares of major U.S. companies with crypto or USD margin for enhanced multi-asset trading.

Broker Comparsion: FXTM vs AvaTrade
FXTM and AvaTrade are two well-established online brokers offering forex and CFD trading across global markets. Both enjoy strong reputations and high ratings on WikiFX—FXTM holds an AAA overall rating, while AvaTrade scores 9.49/10, indicating they’re regarded as reliable choices by the community. However, since brokers have great reputation in the industry, how do we know which one is more suitable for individuals to invest in? Today's article is about the comparison between FXTM and AvaTrade.
WikiFX Broker
Latest News
Love, Investment & Lies: Online Date Turned into a RM103,000 Scam
 WikiFX
Broker Took 10% of User's Profits – New Way to Swindle You? Beware!
WikiFXPi Network: Scam Allegations Spark Heated Debate
WikiFXBroker Comparsion: FXTM vs AvaTrade
WikiFXAccount Deleted, Funds Gone: A New Broker Tactic to Beware Of?
WikiFXBroker’s Promise Turns to Loss – Funds Disappear, No Compensation!
WikiFXEl Salvador and U.S. Launch Cross-Border Crypto Regulatory Sandbox
WikiFXThe Instagram Promise That Stole RM33,000
WikiFXCoinbase Launches Bitcoin Yield Fund for Institutional Investors
WikiFXBefore You Trade the Next Big Thing, Remember the Dot-Com Collapse
WikiFXRate Calc
